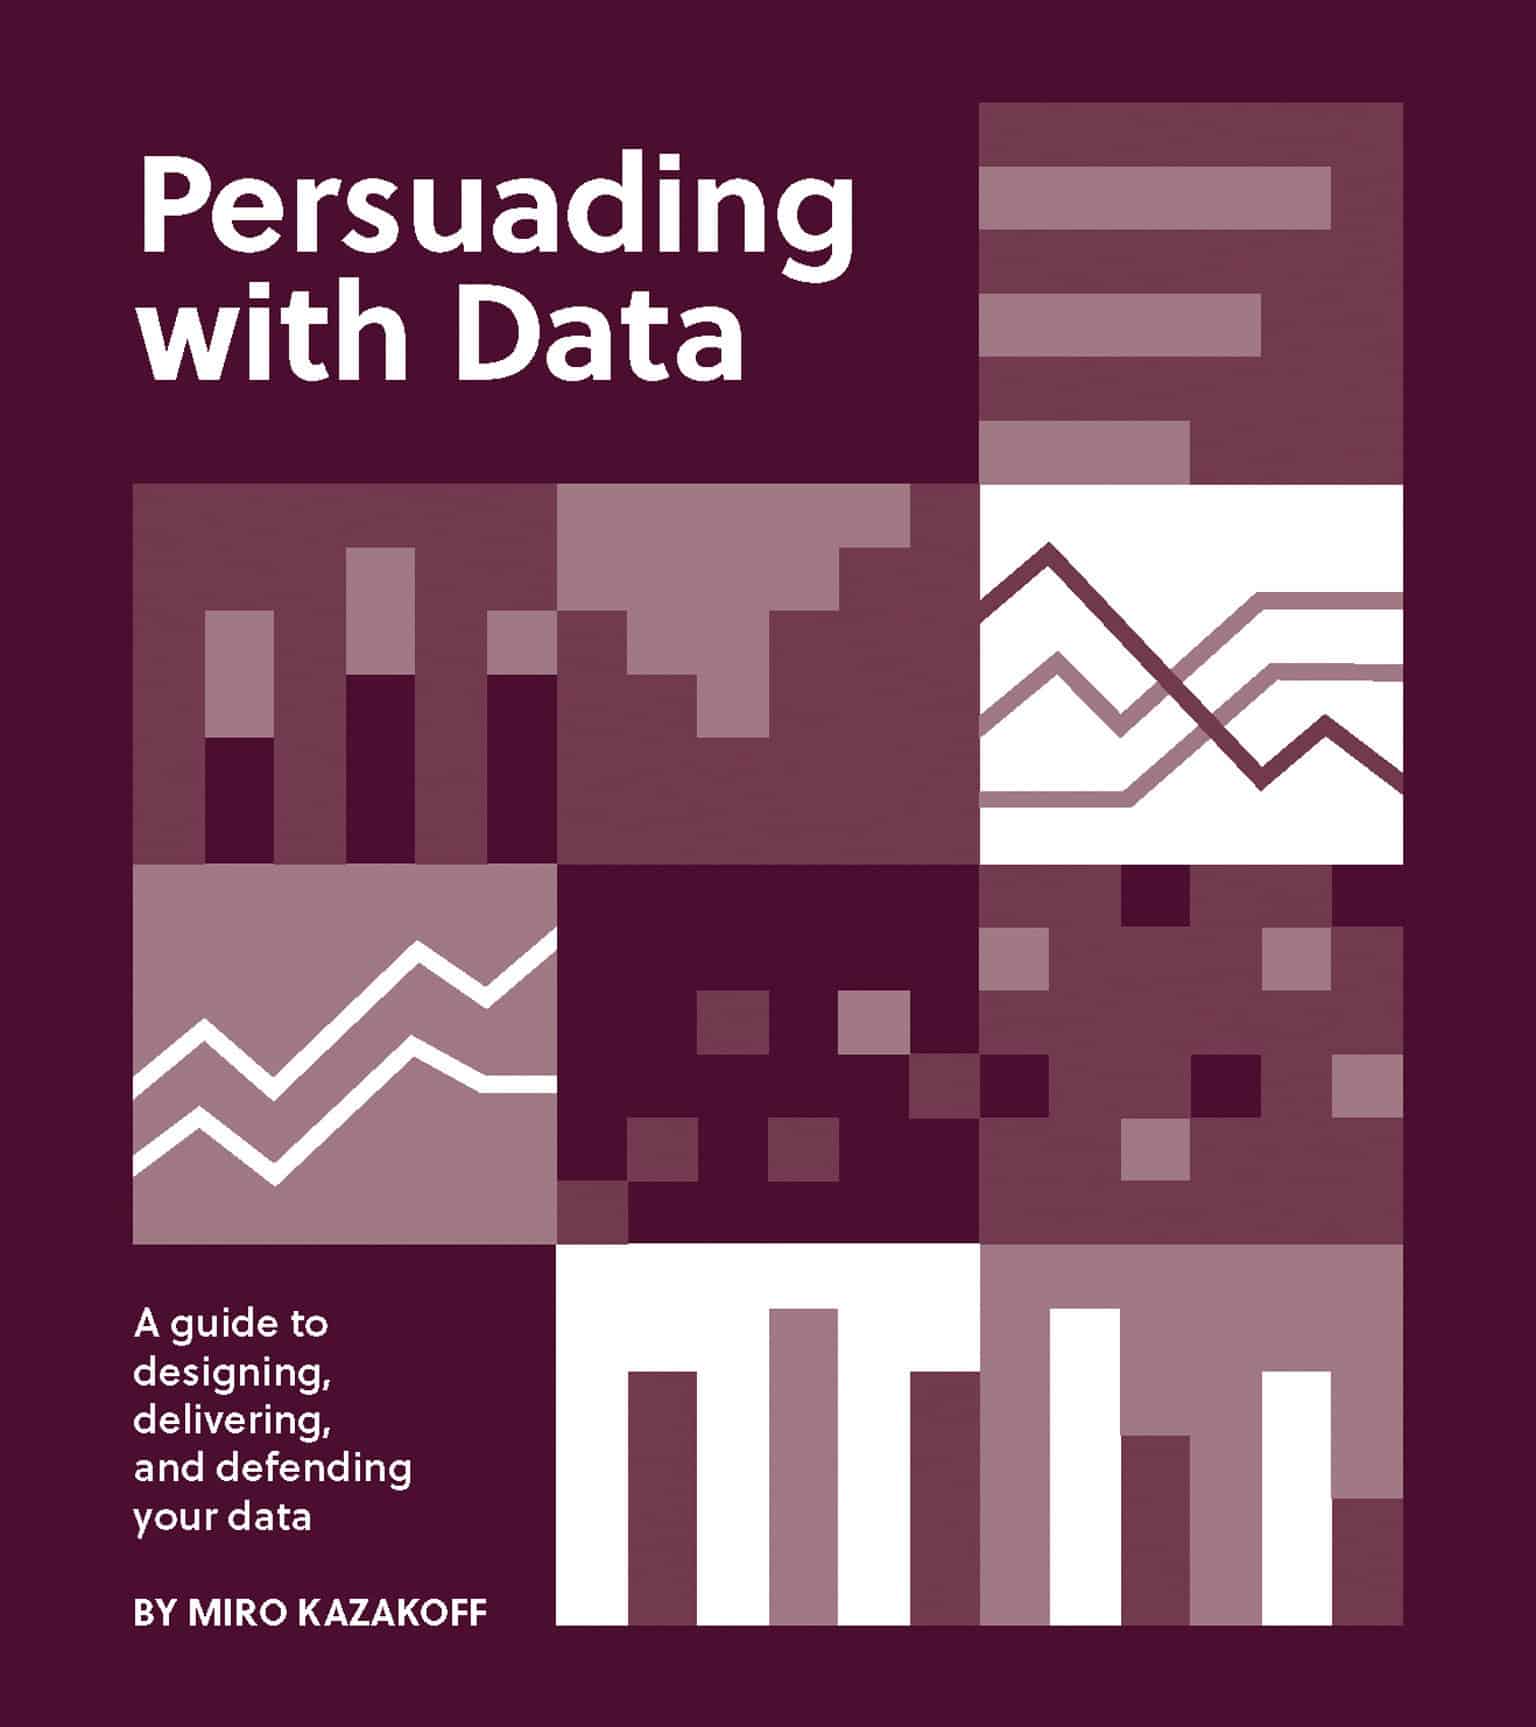
A Guide to Designing, Delivering, and Defending Your Data: Persuading with Data
40.00 JOD
Please allow 2 – 5 weeks for delivery of this item
Description
An integrated introduction to data visualization, strategic communication, and delivery best practices.Persuading with Data provides an integrated instructional guide to data visualization, strategic communication, and delivery best practices. Most books on data visualization focus on creating good graphs. This is the first book that combines both explanatory visualization and communication strategy, showing how to use visuals to create effective communications that convince an audience to accept and act on the data. In four parts that proceed from micro to macro, the book explains how our brains make sense of graphs; how to design effective graphs and slides that support your ideas; how to organize those ideas into a compelling presentation; and how to deliver and defend data to an audience. Persuading with Data is for anyone who has to explain analytical results to others. It synthesizes a wide range of skills needed by modern data professionals, providing a complete toolkit for creating effective business communications. Readers will learn how to simplify in order to amplify, how to communicate data analysis, how to prepare for audience resistance, and much more. The book integrates practitioner and academic perspectives with real-world examples from a variety of industries, organizations, and disciplines. It is accessible to a wide range of readers—from undergraduates to mid-career and executive-level professionals—and has been tested in settings that include academic classes and workplace training sessions.
Additional information
| Weight | 0.561825 kg |
|---|---|
| Dimensions | 1.143 × 20.32 × 22.86 cm |
| by | |
| Format | Paperback |
| Language | |
| Publisher | |
| Year Published | 2022-3-29 |
| Imprint | |
| Publication City/Country | USA |
| ISBN 10 | 0262543273 |
| About The Author | Miro Kazakoff is Senior Lecturer in Managerial Communication at MIT Sloan School of Management. |
| Other text | “Turning data into charts and graphs—and clearly stating their insights—is a bit of an art form. It demands not just analytical skill but also a sense of drama in presenting the insights. Miro Kazakoff has put together a very fine guide to keep you from boring your audience to death.”—Barbara Minto, author of The Minto Pyramid Principle “This book is two books in one! Kazakoff provides all the best practices of data visualization and marries these with the best practices of business communication to provide truly timely, relevant, and valuable content for anyone who wants to get the most impact out of their data.”—Kerrie Aman Carfagno, Associate Professor of Management Communication, McIntire School of Commerce/Darden School of Business Master of Science in Data Analytics Program, University of Virginia |
| Table Of Content | Introduction 1Part I Understanding PerceptionChapter 1 Know Your Own Mind (in order to change others') 8Chapter 2 See How Graphs Work (inside your brain) 20Part II Designing Your DataChapter 3 Choose the Right Graph (for your data) 46Chapter 4 Simplify to Amplify (your message) 78Chapter 5 Build Effective Slides (with the point in mind) 100Part III Organizing Your DataChapter 6 Structure Your Data (so others can follow it) 126Chapter 7 Frame the Data to Persuade (so the audience acts) 168Part IV Delivering and Defending Your DataChapter 8 Present Your Data (with less preparation) 195Chapter 9 Prepare for Resistance (because resistance shows they care) 216Acknowledgments 242Bibliography 247Index 249 |
Only logged in customers who have purchased this product may leave a review.


Reviews
There are no reviews yet.